
Nvidia Is -15% Since May. Can It Hold This Key Support Level... - moo…
Source: moomoo.com
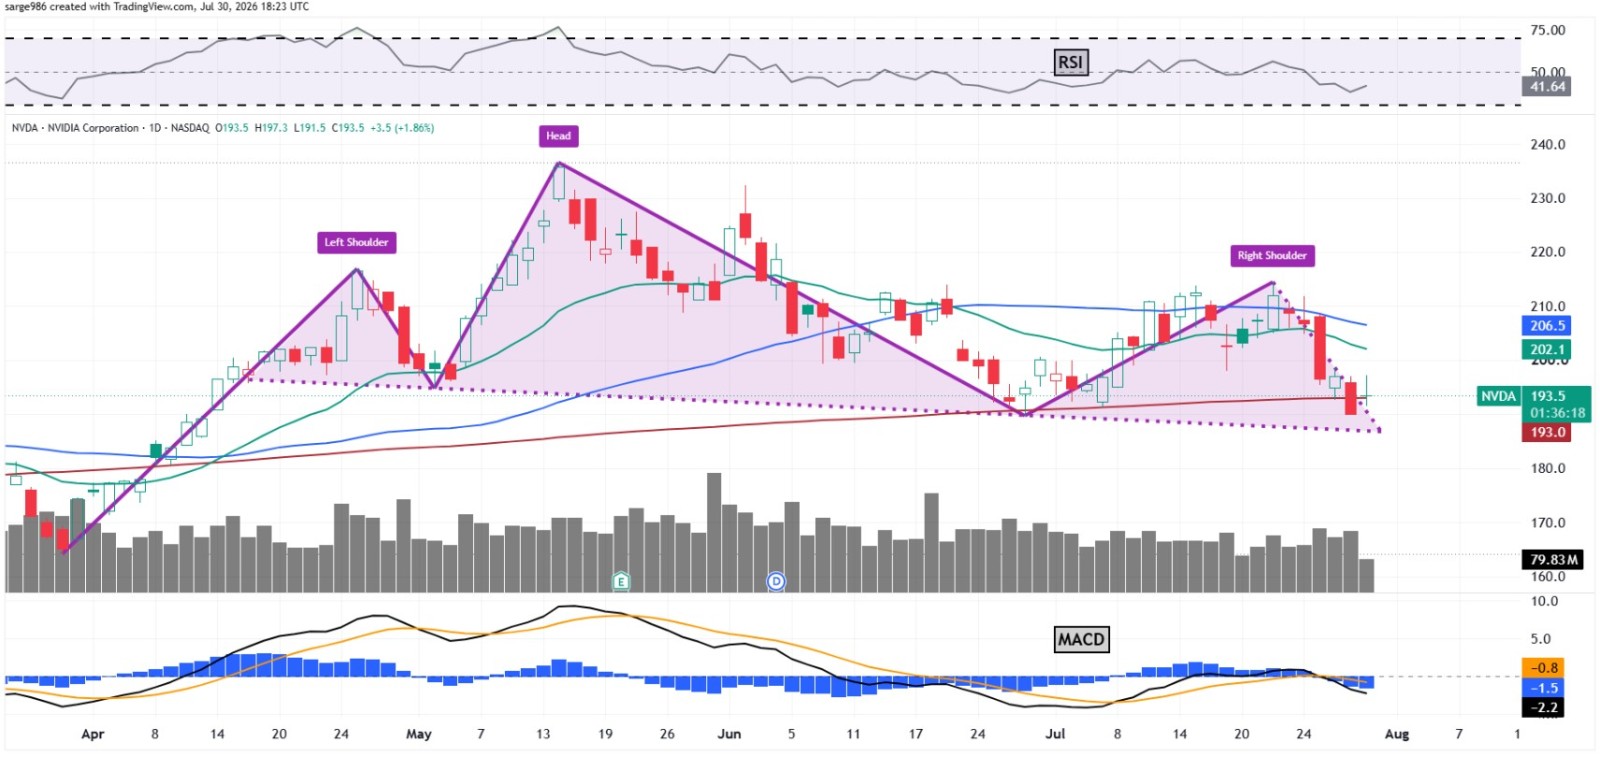
Nvidia has fallen some 15% since hitting a $236.54 all-time high in May, and its chart and fundamentals are under scrutiny. Wall Street expects the chip-design firm to release fiscal Q2 results in late August, with analysts' consensus estimate looking for $2.08 in adjusted earnings per share on more than $91.8 billion of revenue. If realized, those numbers would represent a 98.1% rise from the $1.05 in adjusted EPS reported for the year-ago period, while reflecting 96.5% in year-over-year sales growth. Of the 40 sell-side analysts covering NVDA, 33 have increased their earnings estimates since the period began, three have reduced them, and four left them unchanged. Technically, NVDA has completed a head-and-shoulders pattern of bearish reversal running from early April into the present day. The stock is testing its 200-day Simple Moving Average, marked with a red line at $193, having dropped below this line more than once in recent days; the stock traded at $198.60 pre-market Monday. A definitive cross below the 200-day line would force professional fund managers to decide whether to defend the stock or reduce long-side exposure. The head-and-shoulders pattern bears a $190 pivot, the low of the neckline. The Relative Strength Index has been weakening, while the daily Moving Average Convergence Divergence is bearish but not terribly so, with the histogram of the
SUCKS 0
0
0
Comments
This page shows all existing comments. To add a new comment, open the post in the forum.
No comments yet.